How Likely Will a Bloody War Break Out?
2023-12
Is the world situation getting tight? Will I witness a bloody war as severe as World War II (WWII)?
The question is as significant as the cruelty of wars. Jean-Paul Sartre said, ‘When the rich wage war, it’s the poor who die.’ Ordinary people, unable to escape to a private island in their private helicopter, must either starve in half-destroyed places, constantly running, or become soldiers engaged in killing others violently. They also have to grapple with mental issues throughout their lives, even if they survive the war.
After reviewing the list of wars and discovering many I hadn’t known about, I was amazed at how humans could create so many tragic wars and decided to analyze the war situation and calculate the likelihood of a war occurring in my lifetime.
To start the analysis and calculate the possibility, I should answer these two questions first:
- What defines a war as ‘bloody’?
- Which model is suitable for estimating the probability?
Before delving into the details, let me first share the results:
- The likelihood of humanity experiencing a bloody war, defined as one that results in more than 0.36% of deaths to the global population (288 million deaths based on the current population), by 2050 is estimated to be 99.85%.
- The likelihood of witnessing more than 3 conflicts per year is calculated to be 62.74%.
Surprising facts:
- Considering the population at the time, the bloodiest war wasn’t WWII but one of the Chinese civil wars, the Taiping Rebellion.
- The longest war, Arab separatism in Khuzestan, has lasted for over 100 years and ended in 2022.
- After 1989, there have been no bloody wars, and conflicts have become more frequent, less lethal, and longer.
Data Preparation
The at-hand data includes basic war information such as death tolls and years from Wikipedia, as well as macro data such as global population from the United Nations. While there are some intuitively useful data, such as GDP and military spending for each country, they were not collected until 1960, and their relationship to the war is unclear. Therefore, I will focus on accurate and definitive data for this analysis.
I scraped the war list from the Wikipedia webpage I linked above, and got the name of the war, the year it started, the year it ended, death tolls, and the relationships among wars (e.g., Second Sino-Japanese War, Winter War, and Greco-Italian War are all parts of World War II (WWII)). I picked wars that occurred after 1800, marking the beginning of the late modern period. Some wars have estimated death tolls with minimum and maximum values, and I calculated the mid-value to make it computable and comparable.
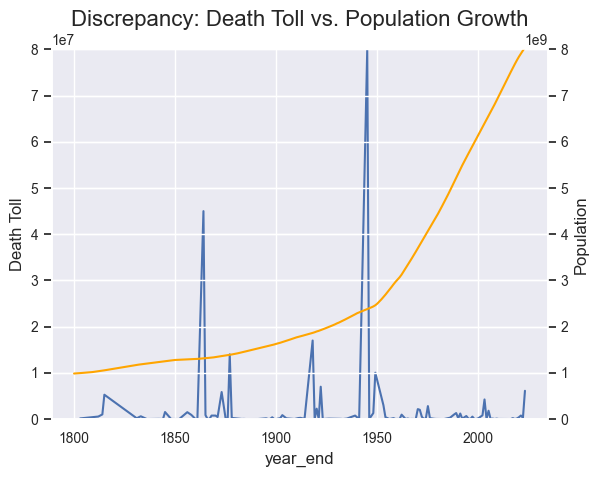
How to evaluate the severity of a war — can I use the death toll directly? I believe it’s not enough, please look at the figure that shows the population is exponentially increasing, which is an influential variable that needs to be taken into consideration. The death toll of 80 million during WWII, considering a population of 2.4 billion, may not be perceived as equally severe as the same number of deaths in a population of 8 billion today.
Death Toll and Duration
While we are all aware that WWII caused the highest death toll in wars throughout human history, my perspective changed dramatically after I calculated the proportion of the death toll to the population. In this context, the Taiping Rebellion, one of the Chinese civil wars, replaced WWII as the war with the highest death toll relative to its population.
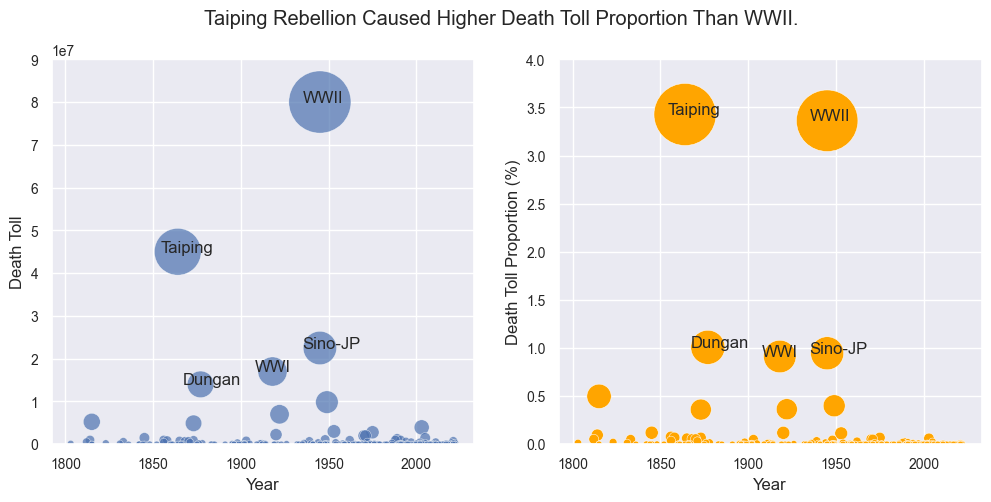
And Dungan Revolt, also one of the Chinese civil wars, surpassed World War I in terms of death toll proportion. Moreover, of the bloodiest 5 wars, 3 were China-related, which could be partly because China had the highest population at that time. Some may argue that major deaths in China should not carry more weight than fewer deaths in more developed countries, but I believe that every human life is of equal importance at the same time, regardless of affluence. So I still keep up with the death toll as the main consideration.
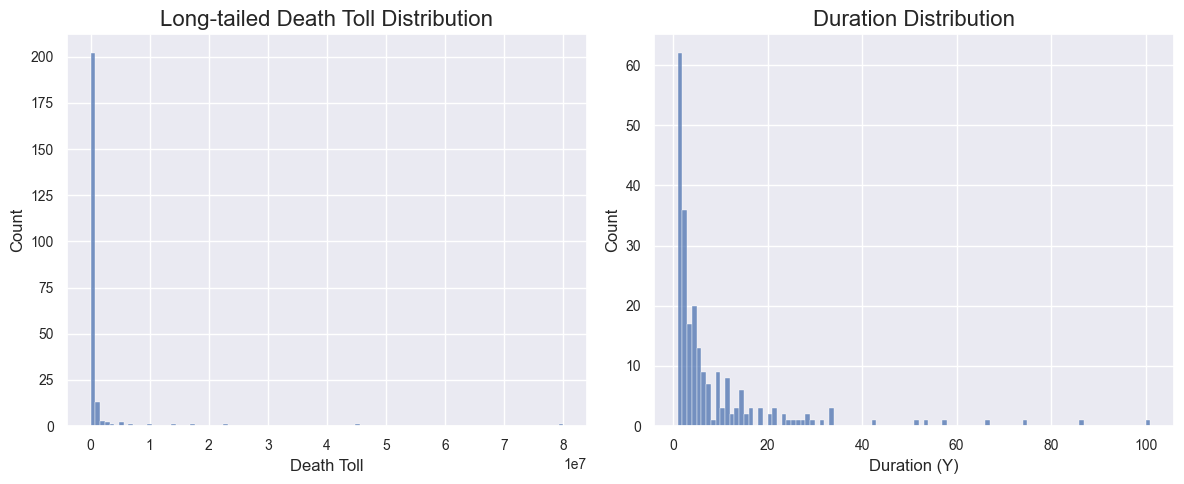
While looking at the death toll and duration distribution of closed wars, I noted that the death toll distribution is highly skewed, signifying that the majority of wars entail smaller casualties, with only a few experiencing exceptionally high death tolls. In contrast, the duration distribution appears more normal. It is important to categorize wars for the following analysis.
Four Kinds of Wars
I aim to categorize wars into four distinct categories ideally:
- ‘Extreme’: wars with an exceptionally high death toll, such as WWII, regardless of duration
- ‘Severe’: relatively high death tolls, regardless of duration
- ‘Conflictual’: wars with a comparatively lower death toll proportion, regardless of duration
- ‘Protracted’: wars with an extremely long duration but with a fair death toll
While I place greater emphasis on death toll than duration, I also hope to avoid overlooking wars with extremely long durations. A protracted war, even if it doesn’t result in a high number of deaths, can inflict significant chronic damage on people over time.
In this regard, I employed K-means clustering with weighted attributes, where the death toll carries 80% weight, and duration carries 20% weight.
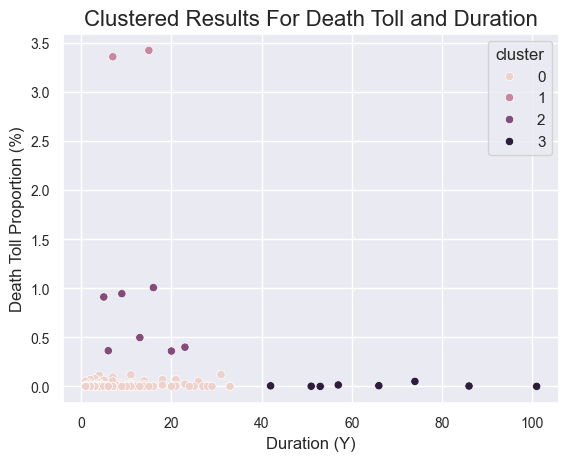
From the graph, I found the result well performed just as I expected. The cluster 0, 1, 2, and 3 can be representative of ‘Conflictual’, ‘Extreme’, ’Severe’, and ’Protracted’, respectively.
Most wars are conflictual, with an average duration of 5.97 years and a death toll proportion to the population of 0.01%. Extreme wars could result in a death toll proportion as high as 3.4%, while protracted wars could last over 66 years. The severe ones, on average, last 13.14 years and cause a death toll proportion of 0.64%.
In conjunction with my analytical expectations, I characterize a Bloody War as the concatenation of Extreme Wars and Severe Wars. A Bloody War is defined as one in which the death toll exceeds 0.36% of the population at the time.
Occurrence Over Time
Let’s have a look at whether the four kinds of wars have different occurrence distributions.
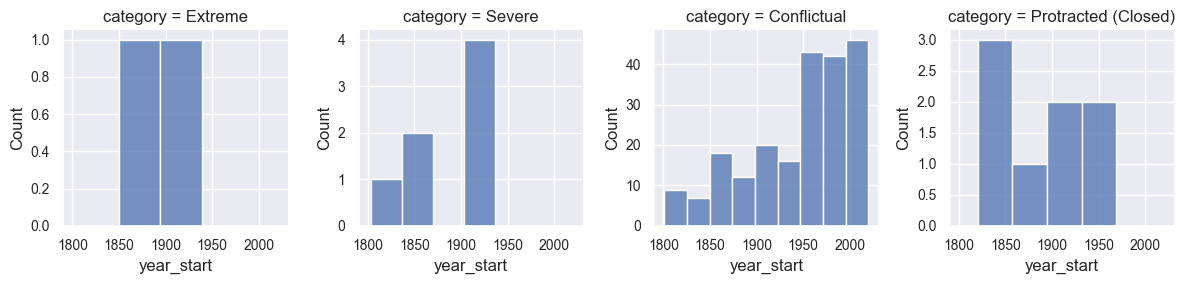
From the graph, the extreme and severe wars only happened before 1945, which was the end of WWII. The 2 extreme wars are:
- World War II (1939–1945)
- Taiping Rebellion (1850–1864)
The 7 severe wars are:
- Second Sino-Japanese War (1937–1945)
- World War I (1914–1918)
- Dungan Revolt (1862–1877)
- Chinese Civil War (1927–1949)
- Russian Civil War (1917–1922)
- Napoleonic Wars (1803–1815)
- Miao Rebellion (1854–1873)
Note: some of the wars are overlapped, for example, the Second Sino-Japanese War is part of WWII. I still count them as two separate wars since their relationship is intersection rather than inclusion. But in the sum calculation of death tolls, I only include the main wars and not the sub-wars.
The protracted wars were only shown before 1945, but they cannot represent anything significant since the average duration of protracted conflicts exceeded 60 years. Therefore, only wars that started before 1945 can be counted in this category.
The category of protracted open wars represents ongoing wars that have exceeded the minimum duration of all protracted closed wars, which is 42 years. The graph above illustrates a significant number of protracted open wars compared to closed ones.
For all the start years of ongoing wars, a majority of them commenced after 1989, the end of the Cold War. This suggests that in the last 30 years, more wars have started, and many of them are characterized by less lethal conflicts, tending to endure or likely to endure for an extended period.
Likelihood of Wars
For extreme and severe wars, I will employ the Bernoulli distribution to calculate the probability of no war occurrence after 1945. The possibility of a war occurring is set at 9 (wars)/145 (years) before 1945, so the possibility of no war occurring is 1–9/145, and the possibility of no war occurring in 100 years should be:
(1–9/145)^100
Here is the likelihood curve over year.
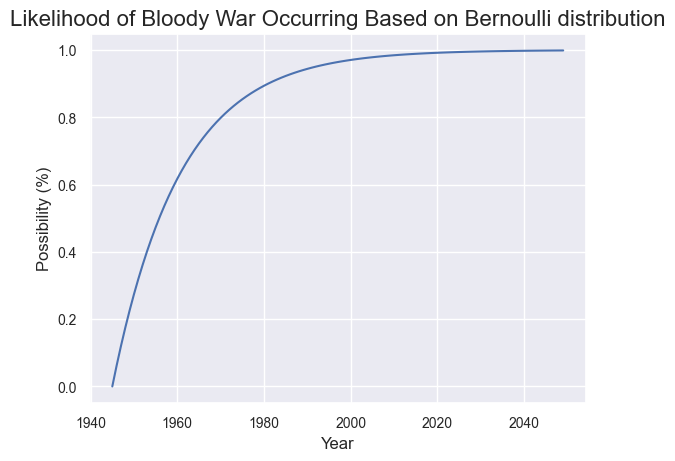
- The probability of maintaining peace until 2023 after 1945 is 0.79%
- Extending this to the year 2050 reduces the probability further to 0.15%
- Therefore, before 2050, the likelihood of humankind encountering a bloody war (which can cause over 0.36% deaths of the world population) stands at 99.85%
In this theoretical model, it’s surprising to realize that the long-term peace we are accustomed to is, in fact, a luxury. But we all know the world has changed both politically and technically, which has driven significant uncertainties to the theoretical model.
Great powers (United States, China, United Kingdom, France, Russia, Germany, Japan, India, Brazil, and Italy) play the conclusive role in influential wars as they have relatively larger populations and are more economically and politically important. However, due to the nuclear, great powers dare not to play too aggressively, and global trade makes them more dependent on the world economy. One of the great powers, Russia, has launched an invasion. While this may not be directed at another great power, it still does not bode well. In addition, the surge in conflicts after 1989 is also a cause for concern.
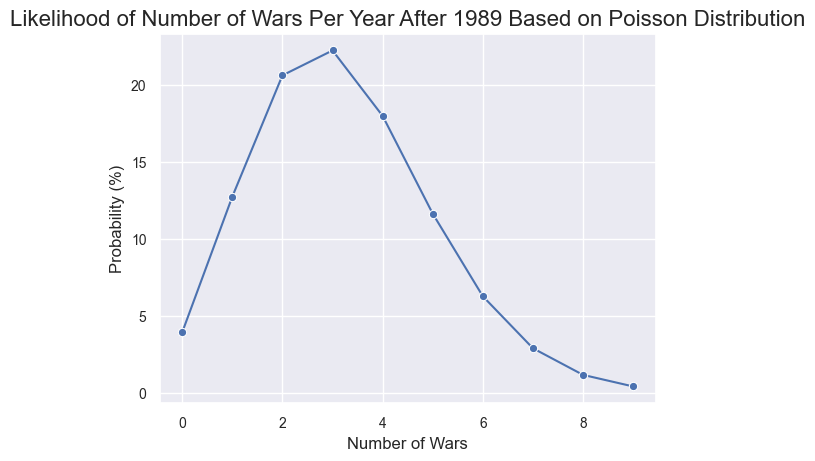
Based on the Poisson distribution, representing the number of war occurrences in a given period, the likelihood that we witness over 3 conflicts per year is calculated to be 62.74%.
Further Steps
The study of war is a multidisciplinary field that draws on insights from disciplines such as political science and international relations, all of which rely primarily on domain knowledge and have less data to work with. It is crucial and novel to transform abstract domain knowledge quantitatively.
This article only uses at-hand data with a few features. To make the inference more comprehensive and accurate, more characteristics can be collected and considered, such as:
- the countries that evolved in the war
- the number of countries/neighboring countries in general
- whether the war was a genocide or not
- whether the war was related to an ideology or not
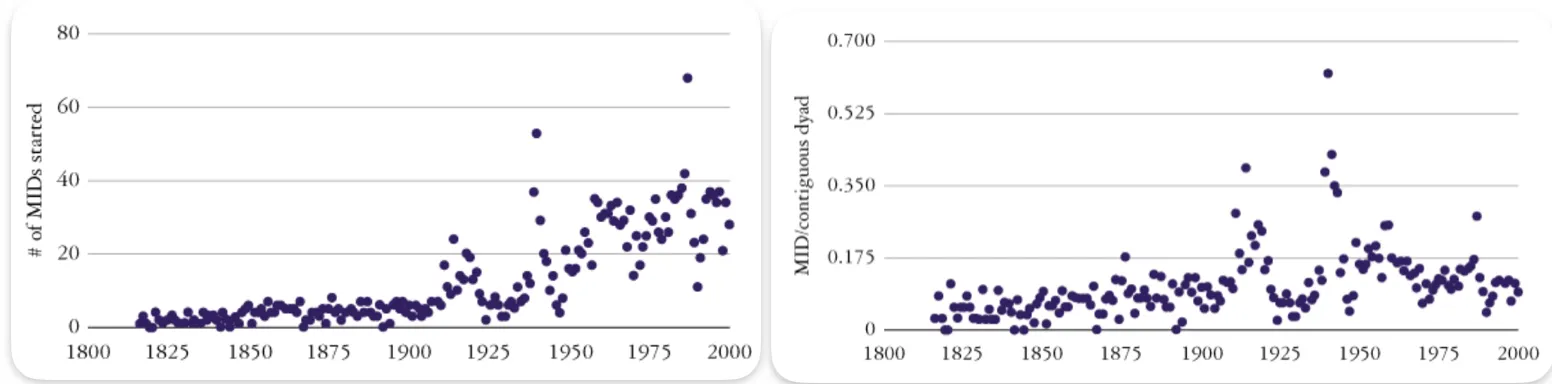
The chart below illustrates the trajectory of wars using the ‘Militarized Interstate Dispute’ dataset. The left side displays the original trends, while the right side depicts trends calculated with counts divided by the number of neighboring countries. This process aims to mitigate the influence of the growing number of countries. On the right chart, a relatively straight trend with a slight slope is observed. (Source: Braumoeller, B. F. (2019). Over the Dead. Publisher.)
In addition, the analysis of great powers can be employed economically and politically. Here are some metrics:
Economics
- Inequality: Gini Coefficient, poverty rate
- Prosperity: GDP, GDP per capita
- Stability: inflation rate, unemployment rate, Foreign Direct Investment Flows
- Development Intentions: education spending, healthcare spending
Politics
- Nationalism: trade balance
- Expansionism: military expenditure, Territorial Changes, international (military) alliances